Roman Road Project - Geophysics
Having borrowed a RM15 resistance meter from the Sussex Archaeological Society (many thanks to them) I undertook a geophysical survey of a field on Street End Lane at Sidlesham with the assiatance of my nephew Jack.
 With the weather clearly in our favour, being glouriously sunny with not a cloud in the sky.
We started by setting out a set of 10m x 10m grids on the ground and measured in the the position of the corners of the grid onto a 1:1250 scale map (to ensure that any features can be located).
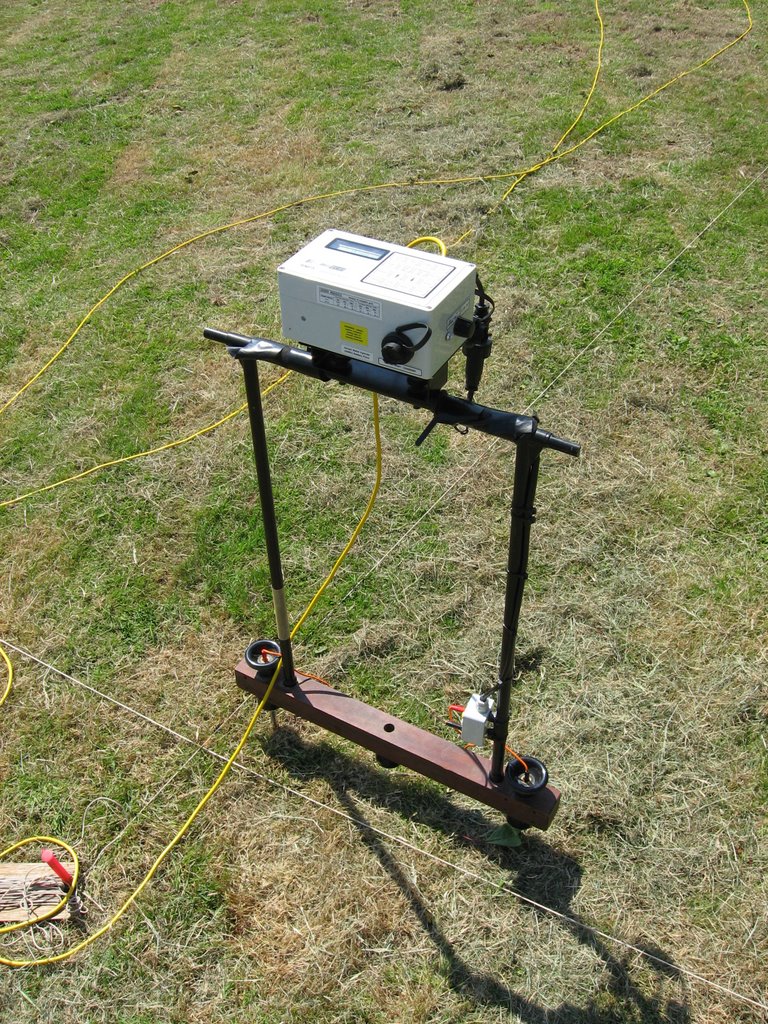
We then set up the RM15 machine (as seen on Time Team!) and set about taking recordings at 1m intervals and recording these on a sheet of paper (no high tech computer interface for us).
As the temperature hotted up, we retreated to the Anchor pub for an excellent lunch and to replenish the liquid levels. We then returned from the pub to finish off the survey.
 When finished, the figures recorded were then plotted on a spreadsheet which replaced the numbers with colours to make the results easier to visualise.
The resistance survey works by measuring the flow of electricity between the probes. A low resistance reading means that the electicity is flowing easily, and may mean that there is a buried ditch or pit (as these will reatin water, helping the electricity flow).
A high rsistance reading means that the electricity can not flow very easily, and may mean that there are walls or areas of rubble.
The lighter colours show areas of low resistance, and the darker colours show the areas of high resistance.
Although nothing is immediately obvious as a feature on the results, there are a few areas that may merit further investigation at a later date.
posted by eon.robertson @ 5:08 PM
0 comments
![]()


0 Comments:
Post a Comment
<< Home